
Example of the creation of light sources
Note: This script requires having SMARTS installed and correctly configured. If you do not have it, comment those lines related to the SMARTS light source.
import numpy as np
import matplotlib.pyplot as plt
from solcore.light_source import LightSource
# The wavelength range of the spectra
wl = np.linspace(300, 3000, 200)
# Now different types of light sources can be defined
gauss = LightSource(source_type='laser', x=wl, center=800, linewidth=50, power=200)
bb = LightSource(source_type='black body', x=wl, T=5800, entendue='Sun')
am15g = LightSource(source_type='standard', x=wl, version='AM1.5g')
smarts = LightSource(source_type='SMARTS', x=wl)
spectral = LightSource(source_type='SPECTRAL2', x=wl)
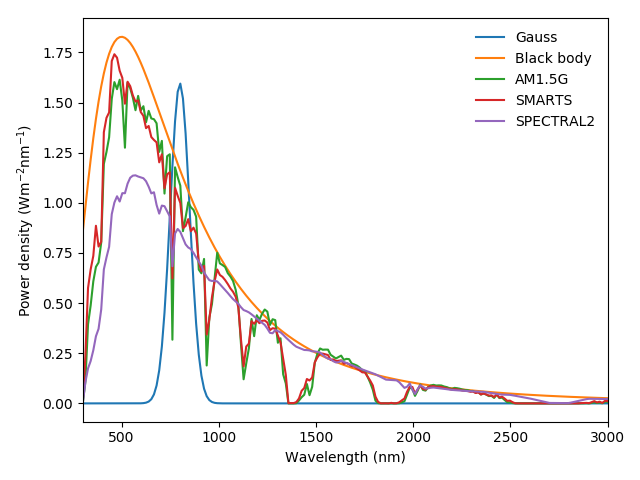
# Plot comparing the different light sources
plt.figure(1)
plt.plot(*gauss.spectrum(), label='Gauss')
plt.plot(*bb.spectrum(), label='Black body')
plt.plot(*am15g.spectrum(), label='AM1.5G')
plt.plot(*smarts.spectrum(), label='SMARTS')
plt.plot(*spectral.spectrum(), label='SPECTRAL2')
plt.xlim(300, 3000)
plt.xlabel('Wavelength (nm)')
plt.ylabel('Power density (Wm$^{-2}$nm$^{-1}$)')
plt.tight_layout()
plt.legend()
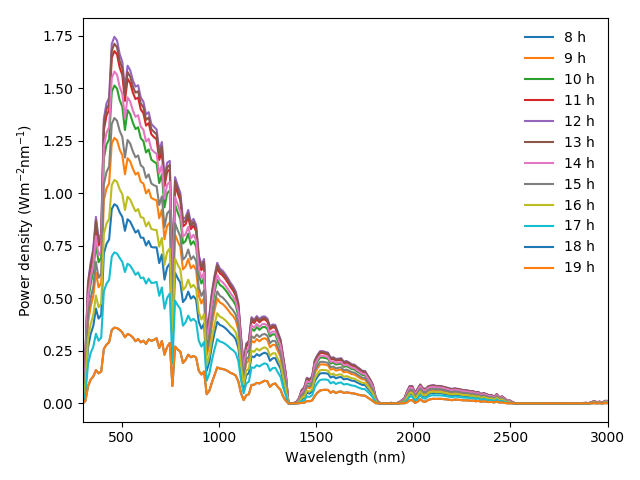
# Plot comparing the spectra calculated with SMARTS at different hours of the day
plt.figure(2)
for h in range(8, 20):
plt.plot(*smarts.spectrum(HOUR=h), label='{} h'.format(h))
plt.xlim(300, 3000)
plt.xlabel('Wavelength (nm)')
plt.ylabel('Power density (Wm$^{-2}$nm$^{-1}$)')
plt.tight_layout()
plt.legend()
plt.show()