
Using the TMM solver to calculate the reflection of a multilayered ARC
Required extra files, available in Solcore’s Github repository (Examples folder):
- AlInP_nk.csv
- GaInP_nk.csv
- MgF_nk.csv
- SiCx_nk.csv
- ZnS_nk.csv
from scipy.interpolate import interp1d
import matplotlib.pyplot as plt
import numpy as np
from solcore.structure import Structure
from solcore.absorption_calculator import calculate_rat
E_eV = np.linspace(0.65, 4, 1000)
def nk_convert(fname, energy):
""" Designed to handle nk data files"""
# Import data...
E_n, n, E_k, k = np.loadtxt(fname, delimiter=",", unpack=True)
print("File :: " + fname + " :: Imported Successfully!")
# Interpolate data...
n_interp = interp1d(E_n, n, bounds_error=False, fill_value=(n[0], n[-1]))(energy)
k_interp = interp1d(E_k, k, bounds_error=False, fill_value=(k[0], k[-1]))(energy)
return (energy, n_interp, k_interp)
# Load nk data using nk_convert function...
alinp_nk = nk_convert("AlInP_nk.csv", energy=E_eV)
gainp_nk = nk_convert("GaInP_nk.csv", energy=E_eV)
mgf_nk = nk_convert("MgF_nk.csv", energy=E_eV)
sic_nk = nk_convert("SiCx_nk.csv", energy=E_eV)
zns_nk = nk_convert("ZnS_nk.csv", energy=E_eV)
# Build the optical stack...
stack = Structure([
[117, 1240 / E_eV, mgf_nk[1], mgf_nk[2]],
[80, 1240 / E_eV, sic_nk[1], sic_nk[2]],
[61, 1240 / E_eV, zns_nk[1], zns_nk[2]],
[25, 1240 / E_eV, alinp_nk[1], alinp_nk[2]],
[350000, 1240 / E_eV, gainp_nk[1], gainp_nk[2]]
])
angles = np.linspace(0, 80, 10)
RAT_angles = []
print("Calculate RAT ::")
for theta in angles:
print("Calculating at angle :: %4.1f deg" % theta)
# Calculate RAT data...
rat_data = calculate_rat(stack, angle=theta, wavelength=1240 / E_eV)
RAT_angles.append((theta, rat_data["R"], rat_data["A"]))
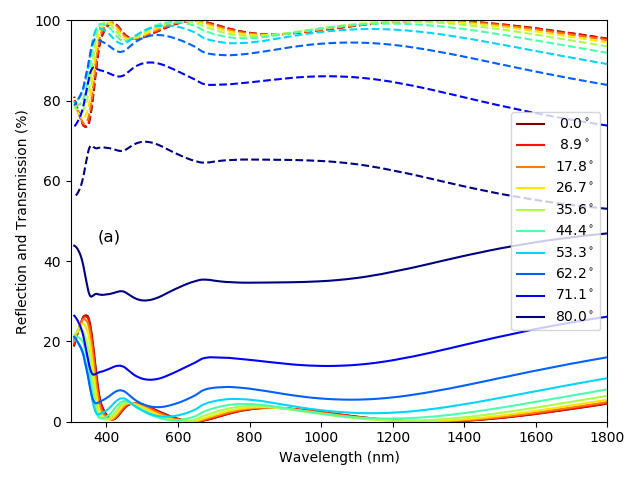
colors = plt.cm.jet(np.linspace(1, 0, len(RAT_angles)))
fig, ax2 = plt.subplots(1, 1)
for i, RAT in enumerate(RAT_angles):
ax2.plot(1240 / E_eV, RAT[1] * 100, ls="-", color=colors[i], label="%4.1f$^\circ$" % RAT[0])
ax2.plot(1240 / E_eV, RAT[2] * 100, ls="--", color=colors[i])
ax2.set_ylim([0, 100])
ax2.set_xlim([300, 1800])
ax2.set_xlabel("Wavelength (nm)")
ax2.set_ylabel("Reflection and Transmission (%)")
ax2.legend(loc=5)
ax2.text(0.05, 0.45, '(a)', transform=ax2.transAxes, fontsize=12)
plt.tight_layout(w_pad=4)
plt.show()