from solcore import material
from solcore import si
from solcore.material_system import create_new_material
from solcore.absorption_calculator import create_nk_txt, download_db, search_db
from solcore.config_tools import add_source
import matplotlib.pyplot as plt
import numpy as np
import os
# When adding custom materials - or getting the refractive index database - the
# information will be stored in the Solcore's users folder. These can be setup by setting
# the SOLCORE_USER_DATA environmental variable to your prefered location or, by default,
# it will be in your home directory, in a directory called .solcore.
# EXAMPLE 1
# need to have n and k data, and a parameter file in the correct format -
# see examples of parameter files in e.g. material_data/Adachi/binaries.txt
# create a new material, silicon-germanium-tin, from input files. Here,
# the parameters in SiGeSn_params.txt have been copied directly from Ge.
create_new_material('SiGeSn', 'SiGeSn_n.txt', 'SiGeSn_k.txt', 'SiGeSn_params.txt')
# Note that the final argument, the parameter file, is optional - if you do not
# provide it, a material will be added with optical constants only, so it can be
# used for optical calculations.
# can now create an instance of it like any Solcore material
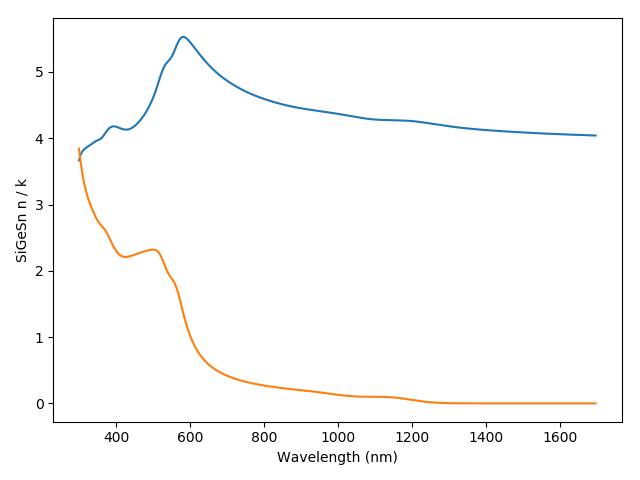
SiGeSn = material('SiGeSn')()
plt.figure()
plt.plot(si(np.arange(300, 1700, 5), 'nm')*1e9, SiGeSn.n(si(np.arange(300, 1700, 5), 'nm')))
plt.plot(si(np.arange(300, 1700, 5), 'nm')*1e9, SiGeSn.k(si(np.arange(300, 1700, 5), 'nm')))
plt.show()
# EXAMPLE 2
# Can also create a Solcore material from a material in the refractiveindex.info database:
# if necessary, download database:
download_db()
# search what options are available for diamond, then use the first result's pageid to
# create data files for the n & k of diamond:
results = search_db('Diamond')
create_nk_txt(pageid=results[0][0], file='C_Diamond')
create_new_material(mat_name = 'Diamond', n_source='C_Diamond_n.txt', k_source='C_Diamond_k.txt')
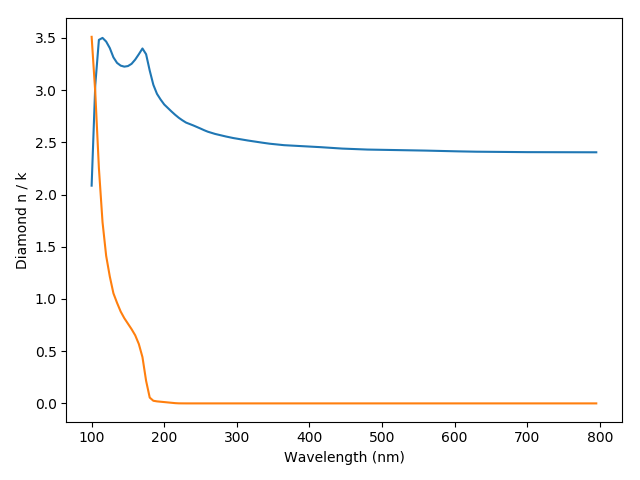
Diamond = material('Diamond')()
plt.figure()
plt.plot(si(np.arange(100, 800, 5), 'nm')*1e9, Diamond.n(si(np.arange(100, 800, 5), 'nm')))
plt.plot(si(np.arange(100, 800, 5), 'nm')*1e9, Diamond.k(si(np.arange(100, 800, 5), 'nm')))
plt.show()